
Your production line doesn't stop because machines break. It stops because NetSuite went down.
Manufacturing companies lose $25,000 to $500,000 per hour when production halts unexpectedly.
Most of that isn't the machines. It's the system that tells those machines what to build, when to build it, and where the parts are.
You built your operation around efficiency. Just-in-time inventory. Lean workflows. Real-time scheduling.
Every minute mapped to margin.
But that efficiency created a single point of failure. When NetSuite goes down, your entire floor goes dark.
Work orders don't generate. BOMs don't load. Your suppliers are sending components for yesterday's schedule because the system can't tell them you changed it.
You can't produce what you can't schedule. You can't schedule what you can't see.
And when the system that holds all of it crashes, you're not just losing production time. You're losing customer commitments, supplier trust, and compliance documentation that regulators will ask about later.
This isn't a technology problem. It's a continuity problem.
And it's costing you more than downtime.
Critical Role of NetSuite Manufacturing Support In Operations
When MRP runs, it explodes BOMs, calculates component requirements, generates purchase requisitions from lead-time offsets, and creates work orders tied to inventory locations.
When operators scan barcodes on shop floor tablets, labor posts to WIP in real time. When operations complete, actual costs accrue and variance analysis isolates overruns.
When this system goes down, production stops immediately.
NetSuite's Central Role
NetSuite manages the entire production execution cycle, from planning through final costing. Every manufacturing function depends on these core capabilities:
- Master demand planning: What to make, when, in what quantity
- BOM and routing management: Component lists, operation sequences, work center assignments
- Work order generation: Instructions to production floor with material and labor requirements
- Inventory management: Tracks raw materials, WIP, finished goods across locations
- Purchasing and supplier management: Component procurement, EDI transmission, ASN receiving
- Quality management and testing: Defect tracking, inspection plans, NCRs linked to lots
- Labor and machine scheduling: Resource allocation, finite capacity validation
- Real-time production tracking: Barcode scanning shows progress, bottlenecks, completions
- Costing and margin calculation: Job costing, actual vs. standard, variance by operation
- Compliance reporting: FDA, ISO, ITAR traceability with lot genealogy
Just-In-Time Manufacturing Dependency
JIT eliminates inventory buffers for capital efficiency. Suppliers deliver on daily or hourly schedules based on your production plan.
Meta-analysis of 41 studies (12,708 companies) shows JIT creates a 0.454 correlation (p<0.000) with operational performance—but the system dependency is absolute.
How JIT works
JIT keeps inventory lean by tying supplier deliveries directly to production schedules:
- Suppliers deliver components on specific schedules (daily or hourly)
- Minimal inventory buffer (2-3 days of materials, not 30)
- Production schedule drives the entire supply chain
- Any production delay creates immediate supplier problems
- Any schedule change requires instant communication
System dependency
NetSuite must stay accurate and available for JIT to function:
- Production schedule accuracy drives supplier delivery timing via EDI
- Schedule changes must transmit immediately or suppliers send wrong materials
- Work orders must be correct—BOM effectivity dates matter
- Material availability must be visible in real time to prevent production halts
- Quality tracking must be continuous because defects cascade fast
Downtime impact with JIT
When NetSuite goes down with JIT running, the entire production system breaks:
- Can't update production schedule (suppliers work from yesterday's plan)
- Can't issue work orders (production floor has no instructions)
- Can't track material availability (production stops while operators search for parts)
- Can't communicate with suppliers (missed shipments, overstock issues)
- Can't track quality (defects create undocumented rework loops)
Make-to-Order Manufacturing Dependency
MTO manufacturing has zero finished goods buffer. Every customer order triggers a complete production sequence that depends on NetSuite at every step.
Scenario
The MTO sequence shows how tightly integrated each step is:
- Customer places order
- NetSuite generates BOM and purchase orders
- Purchase orders sent to suppliers via EDI
- Components received and staged
- Work orders issued to production floor
- Production executes per schedule
- Quality gates passed
- Finished goods shipped to customer
System downtime impact
When NetSuite goes down during MTO operations, every downstream step fails:
- Orders received but can't enter system (no BOM or POs generated)
- Suppliers don't know what or when to deliver
- Components miss delivery windows (production delayed)
- Production floor doesn't receive work orders
- Quality gates skipped (ship defective product or stop production)
- Customer delivery missed (contractual penalties, lost trust)
Complexity of Modern Manufacturing
Modern manufacturing operates across multiple facilities with consolidated planning, complex supplier networks, and strict regulatory requirements.
NetSuite coordinates all of it.
Multi-plant operations
Manufacturing across locations requires system-wide coordination:
- Master schedule in NetSuite coordinates all plants
- Material flows between plants via transfer orders
- Transfers tracked with in-transit inventory
- Consolidation and financial reporting roll up WIP by site
- Performance tracking spans plants
Complex supply chains
Supplier management requires detailed tracking and compliance:
- Multiple approved suppliers per component with preference ranking
- Supplier quality requirements enforced at receiving inspection
- Lead time dependencies between primary and secondary suppliers
- Seasonal supplier capacity constraints
- Supply chain compliance (conflict minerals, labor standards, RoHS)
Quality and compliance
Regulatory requirements demand complete traceability:
- FDA 21 CFR Part 11 electronic signatures and audit trails
- ISO 9001 lot traceability with forward/backward genealogy
- ITAR export authorization tracking
- Lot tracking for recall capability (which finished goods contain suspect batches)
- Defect documentation linked to work orders and operations
- Non-conformance reports with corrective action tracking
- Audit trail requirements for regulatory compliance
Operational Metrics at Risk
When NetSuite goes down, operational visibility disappears immediately. Production, inventory, quality, and compliance tracking all break simultaneously.
During system downtime
Critical operational data becomes unavailable:
- Production schedule uncertainty: Shop floor doesn't know what to build
- Inventory visibility loss: Component locations unknown, MRP calculates from stale data
- Supplier communication breakdown: Schedule changes don't transmit, deliveries arrive for cancelled orders
- Quality tracking gaps: Inspection results on paper, can't link to lots or work orders
- Costing inaccuracy: Labor tickets delayed, WIP balances wrong, variance analysis frozen
- Compliance documentation gaps: Lot genealogy incomplete, can't respond to recall inquiries, audit trail broken
You built efficiency through integration. You created single points of failure.
The question isn't whether downtime happens. It's whether you recover in 15 minutes or lose the shift.
Manufacturing Downtime (Quantified Business Impact)
Manufacturing downtime isn't abstract. It's measurable, predictable, and expensive.
When NetSuite goes down, production workers still get paid. Equipment still accrues maintenance costs. Suppliers still ship materials. Customers still expect delivery. But nothing moves forward.
Here's what it actually costs.
Direct Production Losses
Production shutdown creates immediate, measurable costs that accumulate by the hour.
Shutdown costs
Every hour of downtime hits your P&L directly:
- Hourly labor cost: Production workers paid but not producing
- Equipment idle costs: Maintenance accrual, no output, utilities running
- Opportunity cost: Lost production you can't catch up
- Expedited procurement: Premium rates to catch up schedule
Calculation for a typical manufacturer
The math is straightforward:
- Production workers: 50 employees × $30/hour = $1,500/hour labor
- Equipment idle (machine time, utilities, depreciation): $2,000-$5,000/hour
- Maintenance and overhead during shutdown: $500-$1,000/hour
- Total direct hourly cost: $4,000-$7,500/hour
Supplier and Supply Chain Costs
Downtime doesn't just stop your production. It cascades through your supply chain.
Supplier communication breakdown
When EDI and purchase order updates stop flowing:
- Suppliers don't know to stop deliveries (overstock buildup)
- Suppliers don't know production delayed (under-deliver when you resume)
- Material arrives but can't be staged (receiving bay overflow)
- Emergency purchases at premium rates (expedited shipping, rush fees)
- Supplier penalty fees (contractual minimum purchases missed)
Supply chain cascading
Your downtime creates ripple effects.
If you're a downstream supplier, your production drives their schedule, cascading delays. If you're upstream, customers delay payment or cancel orders.
Inventory builds up, tying capital and creating carrying costs.
Estimate: $1,000-$5,000/hour depending on supply chain complexity.
Quality and Compliance Costs
Missing quality controls during downtime creates expensive problems later.
Products ship without proper testing. Customers discover defects. Warranty claims and returns pile up.
If it's a safety issue, recall costs escalate. Compliance audit findings appear (FDA, ISO violations). Reputational damage spreads.
Compliance documentation gaps break traceability chains. You can't recall specific lots.
Audit trails are incomplete. Regulatory penalties apply (FDA, EPA, industry-specific). Legal liability increases for product failures or injury claims.
Estimate: $5,000-$50,000+ depending on severity and industry.
Customer and Revenue Impact
Missed delivery commitments damage relationships and revenue.
Customer delivery dates slip. Contractual penalties apply. Customers find alternative suppliers. Purchase orders get cancelled.
Reputation damage spreads through industry word-of-mouth. Strategic customer relationships suffer, especially major accounts.
Estimate: $10,000-$100,000+ depending on customer importance.
Real-world examples
Example 1: Medical Device Manufacturer
$50M revenue, 200 employees, 2-hour unplanned downtime:
- Direct costs: $4,000 × 2 hours = $8,000
- Customer delivery miss: 10 units lost (×$5,000/unit) = $50,000
- Compliance documentation gap: 200 units require re-documentation = $2,000
- Total: ~$60,000 for 2-hour outage
Example 2: Automotive Supplier
$100M revenue, 500 employees, 4-hour unplanned downtime:
- Direct production costs: $6,000 × 4 hours = $24,000
- Inventory buildup: 2,000 units stranded = $10,000 in excess inventory
- Emergency procurement: 20% markup on $100,000 catch-up order = $20,000
- Customer production line stopped (your components are critical): $100,000+ customer claim
- Total: ~$144,000+ for 4-hour outage
Annual Risk Calculation
Conservative assumption: 2 unplanned downtime events per year (20 minutes each) = 40 minutes total. At $4,000-$7,500/hour, annual cost is $2,700-$5,000.
More realistic: 3-6 downtime events per year. Annual cost: $10,000-$40,000 in downtime costs alone.
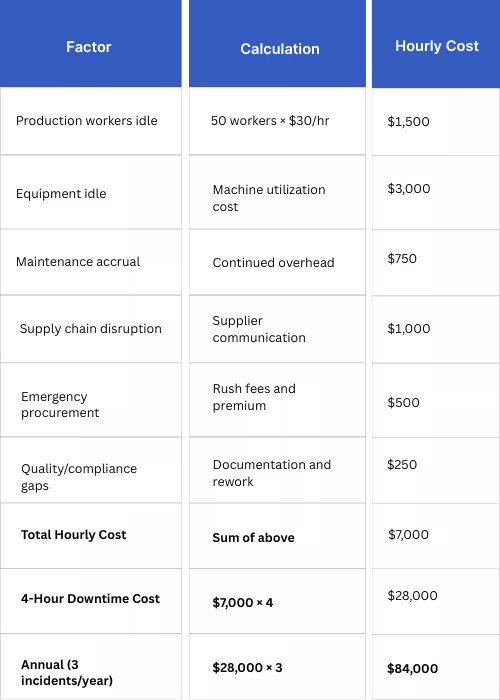
Downtime Cost Calculator
Here's what each hour of downtime actually costs:
You've calculated the ROI on every other system. Calculate this one.
7 Common NetSuite Failures in Manufacturing
NetSuite failures follow patterns. The same bottlenecks appear across manufacturers because the same configurations get skipped, the same customizations break under load, and the same integrations fail.
Here's where systems actually break and why.
Failure 1: Work Order Queue Backup
During peak production, NetSuite struggles to generate work orders.
New orders arrive but can't create work orders. Production floor doesn't receive instructions. Orders back up in queue. Eventually timeouts occur and the system gets stuck.
- Root cause: Database performance degradation under load, batch work order generation taking too long, custom code inefficiency, insufficient resources allocated.
- Impact: Production floor idle waiting for work orders. Customer delivery delays. Labor cost without output.
Failure 2: BOM Lookup Performance Collapse
Work order creation includes BOM lookup. With thousands of BOMs and variants, lookup times increase. System progressively slows. Eventually timeouts prevent work order creation entirely.
- Root cause: BOM table not properly indexed, complex multi-level BOM hierarchies, inefficient custom BOM lookup logic, too many concurrent lookups.
- Impact: Production scheduling impossible. Material planning inaccurate. Supplier communication delayed.
Failure 3: Real-Time Inventory Visibility Loss
System goes down. Can't see current inventory levels. Production floor doesn't know what components are available.
Either stop production or guess (creates errors). Suppliers don't know what's in stock (over/under order).
- Root cause: No distributed inventory visibility, no redundant inventory database, no offline capability, no cache or local reference data.
- Impact: Production scheduling uncertainty. Supplier communication breakdown. Inventory discrepancies.
Failure 4: Batch Process Failures
Nightly batch processes fail—material receipts don't process. Morning arrives. Expected materials aren't in system. Production can't proceed because materials aren't marked available. Downstream processes blocked.
- Root cause: Complex batch logic fails in edge cases, integration to supplier systems broken, database locks preventing batch execution, insufficient error handling/recovery.
- Impact: Production delayed until resolved. Material sitting in receiving but unusable. Production schedule disrupted.
Failure 5: Quality Tracking System Outage
Quality management module goes down. Can't record test results. Can't approve components for production. Production can't progress past quality gate.
- Root cause: Inadequate infrastructure for concurrent users, integration to testing equipment broken, system overload during testing periods.
- Impact: Production halted at quality gate. Compliance documentation gaps. Potential for defective products.
Failure 6: Third-Party Integration Failures
EDI connection to supplier breaks. Purchase orders can't transmit. Suppliers don't receive orders. Material delivery delayed.
- Root cause: Integration outage (supplier system or middleware), API rate limits exceeded, authentication token expired, network connectivity issues.
- Impact: Supply chain communication broken. Material shortages. Production delays cascade.
Failure 7: Custom Code Defects
Custom script or user event fails. Work order creation includes custom logic (calculates quantities, sets priority). Custom code has bug. System error occurs. Work order creation fails.
- Root cause: Inadequate custom code testing, code doesn't handle edge cases, performance issues with custom code, timeout during execution.
- Impact: Production orders stuck. Manual workaround required. Production floor confusion.
Failure Prevention Checklist
Each failure type has specific prevention, detection, and response protocols:
.avif)
These failures aren't hypothetical. They're documented, repeatable, and preventable with proper setup.
24/7 Manufacturing Support Strategy
Manufacturing doesn't stop at 5 PM. Neither should your support.
When work order generation slows at 2 AM, when batch processes fail overnight, when EDI connections drop on Saturday, you need someone who can fix it before your Monday morning shift notices.
Here's what actual 24/7 support looks like.
24/7 Monitoring and Alerting
Monitoring catches problems before they become outages. These are the metrics that matter:
What needs monitoring
System health indicators that predict failures:
- Database performance (response time, query times)
- Application performance (work order generation time)
- Transaction processing (orders/hour, completions/hour)
- Integration health (EDI connections, API calls)
- Batch process completion (receipts, shipments)
- User access (concurrent users, license usage)
- System resources (CPU, memory, disk utilization)
- Error rates (system errors, custom code exceptions)
Alerting thresholds
Specific thresholds trigger immediate response:
- Response time >3 seconds: Alert
- Work order creation time >10 seconds: Alert
- Batch job failure: Immediate alert
- Database query time >5 seconds: Alert
- Integration failure: Immediate alert
- System error rate >1%: Alert
- Memory utilization >80%: Alert
- Disk space <10%: Alert
Alert response protocol
When alerts trigger, response follows a defined sequence: immediate notification to on-call team, automatic diagnosis runs diagnostic queries, page escalation if not resolved in 5 minutes, executive notification if critical production impact.
Incident Response Team Structure
Three-tier escalation ensures the right expertise responds to each issue.
- Level 1: Support Engineer (24/7 on-call rotation) monitors alerts, handles initial troubleshooting, performs basic restarts and resets. Response target: 15 minutes. Resolution target: 1 hour for critical issues.
- Level 2: Senior Engineer (escalation, 24/7 coverage) handles database optimization, complex troubleshooting, custom code debugging. Response target: 5 minutes. Resolution target: 2 hours for critical issues.
- Level 3: Architect (on-call for critical issues) makes system redesign decisions, deploys emergency patches, creates major workarounds. Response target: 15 minutes. Resolution target: 4 hours for critical issues.
Redundancy and failover
Single points of failure are eliminated through redundancy at every layer.
- Database redundancy: Primary and secondary database with real-time replication. Automatic failover if primary fails. Zero data loss. Minimal downtime (<1 minute).
- Application server redundancy: Multiple load-balanced application servers. Traffic automatically routes to healthy servers. Seamless failover. No downtime.
- Backup and recovery: Hourly backups for critical data. Daily full backups. Tested recovery procedures. Recovery time target: <1 hour. Recovery point objective: <30 minutes data loss.
Preventive maintenance
Problems get caught before they cause outages.
- Weekly: Performance analysis and trending, error log review, batch job review, integration health check, capacity trending.
- Monthly: Database optimization pass, index analysis and rebuild, custom code performance review, report performance optimization, user feedback review.
- Quarterly: Disaster recovery testing, failover testing, performance baseline update, capacity planning, system architecture review.
Communication and escalation
Transparency matters during incidents. Immediate notification goes to ops and plant managers. Status updates every 15 minutes during incidents. Root cause analysis upon resolution. Preventive actions documented to avoid recurrence.
Monthly executive reporting includes uptime percentage (actual vs. target), incident summary (what happened, impact, resolution time), preventive actions taken, upcoming maintenance, trend analysis.
24/7 Support Model Comparison
Different support models deliver different results:
.avif)
The question isn't whether you need 24/7 support. It's whether you can afford the alternative.
Preparing for Production Uptime
You don't fix reliability during an outage. You fix it before one happens.
Here's the four-week plan to eliminate unplanned downtime.
Current State Assessment (Week 1)
Start by understanding what's actually failing:
- System uptime history: how often does NetSuite go down?
- Incident root causes: what fails most often?
- Current monitoring and alerting: what's being watched?
- Support coverage: when is someone available?
- Backup and recovery procedures: tested recently?
- Integration health: EDI and supplier systems functioning?
- Production dependencies: What's critical to operations?
Gap Identification (Week 2)
Compare current state to requirements and find the gaps:
- Monitoring gaps: What's not being monitored?
- Alert gaps: What should trigger alerts but doesn't?
- Support coverage gaps: When is no one monitoring?
- Redundancy gaps: Where are single points of failure?
- Backup/recovery gaps: How quickly can you actually recover?
- Integration resilience gaps: What happens when connections fail?
Action Plan (Week 3-4)
Close the gaps with specific implementations:
- Implement monitoring: Deploy for all critical systems
- Configure alerting: Set thresholds based on production impact
- Establish 24/7 support: Define escalation paths and on-call rotation
- Implement redundancy: Add failover for critical components
- Validate backup/recovery: Test procedures through actual restoration
- Document incident response: Create step-by-step playbooks
- Schedule team training: Ensure everyone knows new procedures
Ongoing Management
Reliability requires continuous attention:
- Weekly: Performance reviews catch degradation trends
- Monthly: Preventive maintenance optimizes indexes and code
- Quarterly: Disaster recovery testing validates failover
- Continuous: Incident tracking identifies patterns
- Continuous: Optimization prevents future issues
The manufacturers who run 99.8%+ uptime didn't get there by accident. They followed this plan, executed it completely, and maintained it consistently.
Protect Production Continuity
You've built efficiency through NetSuite. Now protect it.
Unplanned downtime costs $4,000-$7,500 per hour in direct losses. Add supplier disruption, quality gaps, and missed deliveries—the real cost is $28,000+ per incident. Most manufacturers face 3-6 incidents per year.
You can't eliminate every failure. But you can eliminate the recovery time.
Schedule a Production Uptime Assessment to evaluate your current setup.
We'll review your system reliability, analyze production dependencies, assess downtime risk and impact, identify support capability gaps, and build an uptime improvement roadmap—no obligation consultation.
The manufacturers running 99.8%+ uptime followed this plan. They didn't accept downtime as inevitable. They prepared for it, prevented it, and when it happened, recovered in minutes, not hours.
Your production depends on it.


